BI Solution for Smarter Construction Project Management

Construction Company Seeking Custom BI Solution
Our client, YIT, specializes in developing and constructing residential and administrative real estate.
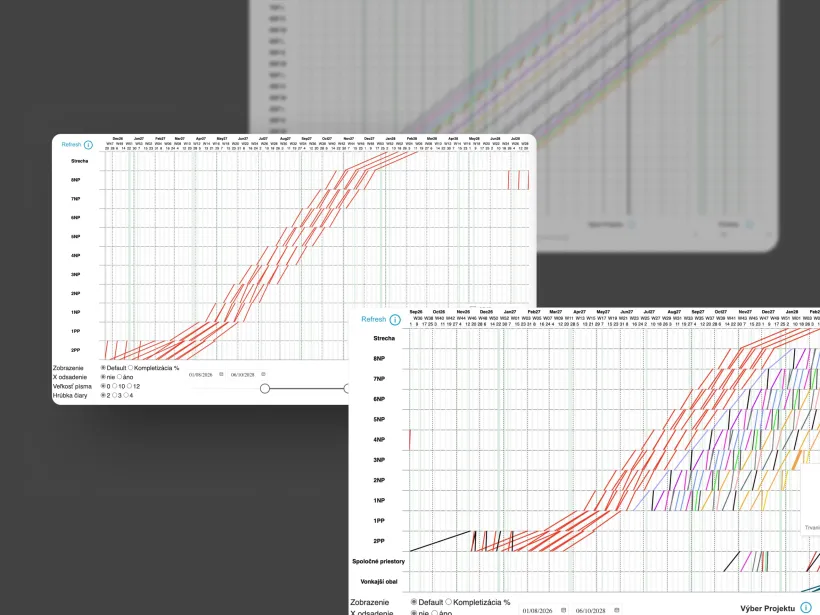
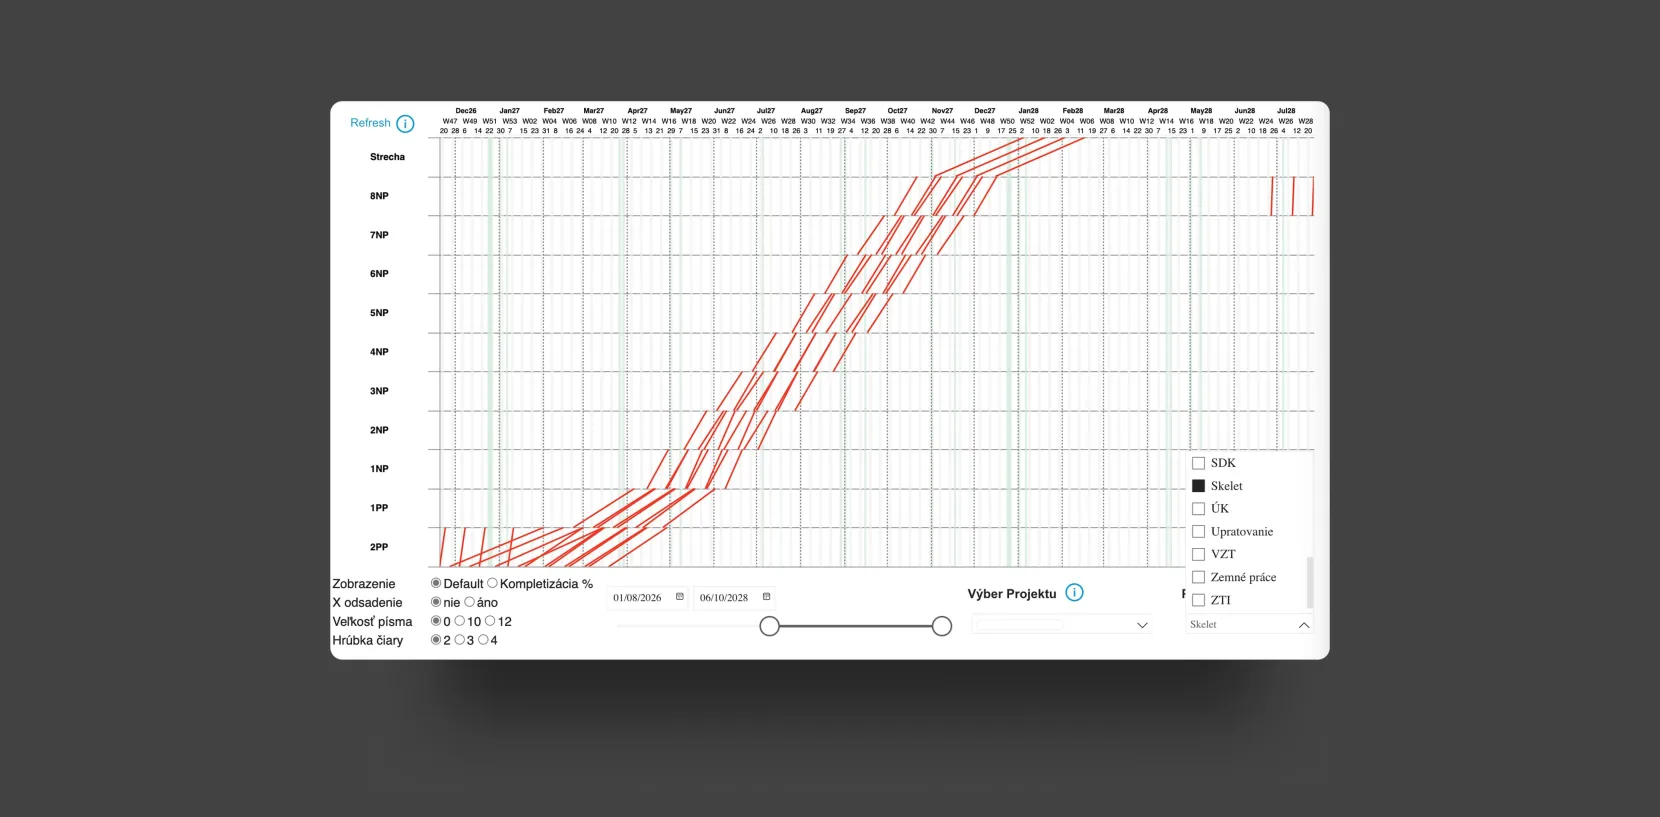
They had been using construction planning software from its Finnish parent company, which featured a specific type of diagram—a flowline chart. When they decided to transition to Power BI, they encountered a problem: It does not include an out-of-the-box solution or any other graph that could be easily customized to meet this requirement. There was no ready-made solution for this requirement.
From Outdated Software to Custom BI Solution
The client was looking for a company that could create a flowline chart directly in Power BI. To face this challenge, we used Deneb, an official Microsoft-certified plugin for Power BI. This tool offers extensive visualization capabilities through the Vega-Lite programming language. The client trusted us to implement a flowline chart, something that didn’t exist in Power BI but could significantly improve their workflow by providing a better overview, planning, and decision-making.
The goal was to provide a clear overview of construction work on different floors, enabling more efficient planning.
Interactive Flowline Chart Report in Power BI
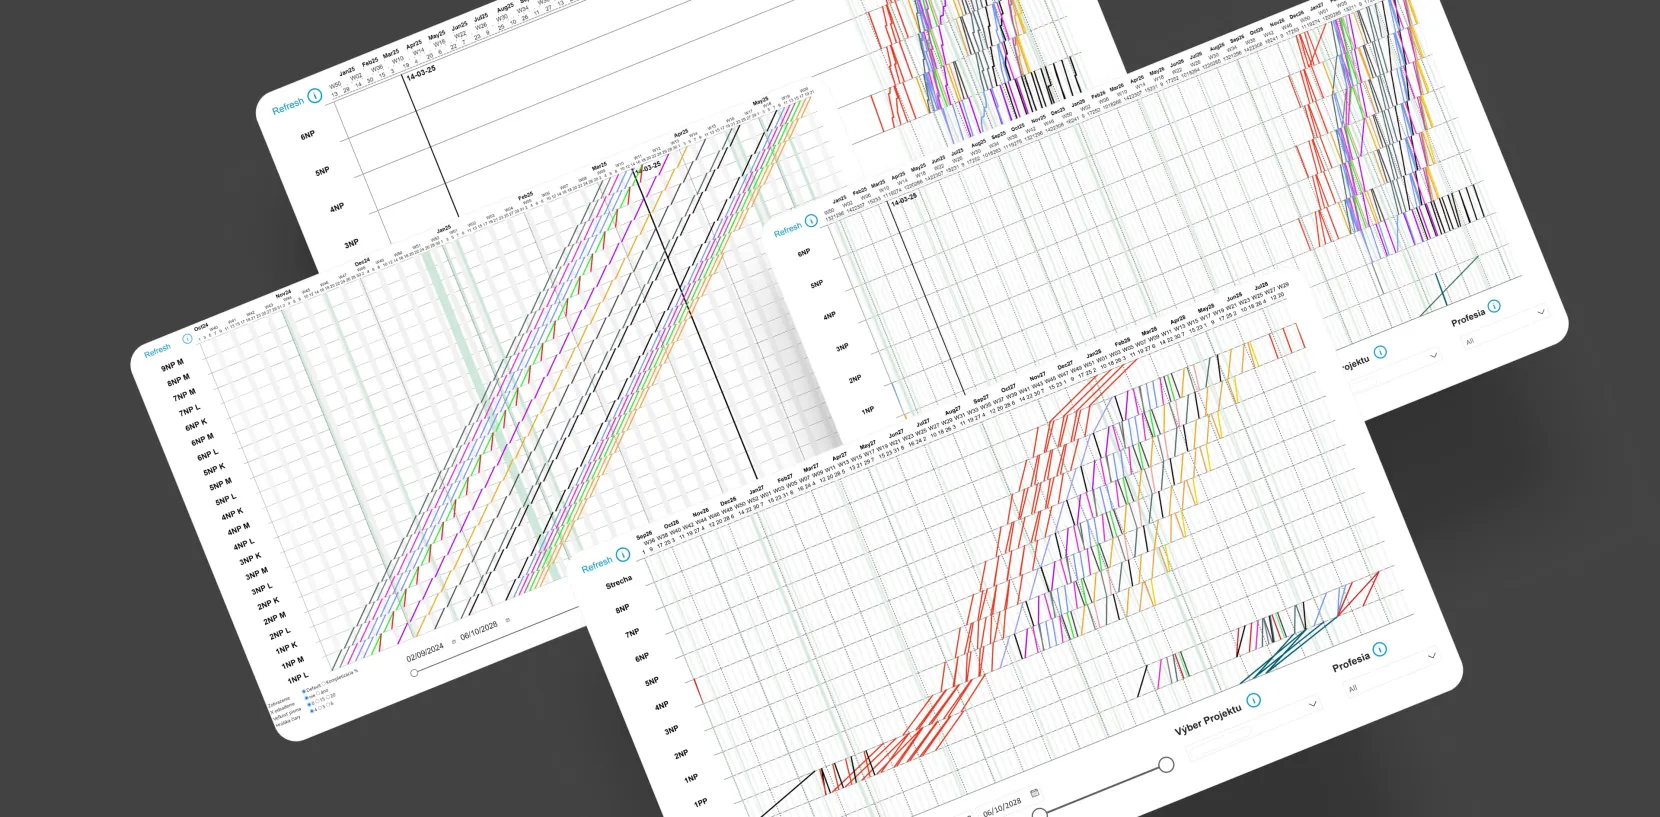
We've built an interactive and customizable flowline chart report that improves construction planning within Power BI. The custom report includes a task overview with details such as task name, location, completion percentage, start and end times, and duration. It features an improved visualization with a well-structured design and additional insights. Interactivity and customization options allow users to adjust axes, change fonts, and modify the display settings.
The final solution is user-friendly and offers more flexibility than the client’s initial software, ultimately improving the planning and tracking of construction processes.
Four-Step Process for Creating a Chart
Creating a custom flowline chart report in Power BI involved a four-step process. First, the necessary data was imported into Power BI. Then, the data was transformed and refined in Power Query to fit the required structure. A data model, including relationships and necessary calculations, was created. Next, the custom visualization was built using Vega-Lite through the Deneb plugin.
Finally, iterative feedback was incorporated, and the report was refined based on client input, and final adjustments were made.
Simplified Integration and Diagrams in Power BI
Connecting to the YIT data source – Integration and data loading into Power BI.
Data transformation in Power Query – Adjusting and structuring the data as required.
Custom visualization coding – Implementing the flowline chart in JSON using Vega-Lite through DENEB (an official, certified plugin for Power BI).
Iterative incorporation of client feedback
The result is a fully customized flowline chart for efficient construction planning in Power BI.
Transforming Construction Planning with a Data-Driven Flowline Chart
We designed a user-friendly and responsive flowline chart that enables efficient construction planning and supports strategic decision-making.
Key Benefits:
Better Planning – Identify gaps, track deadlines, and manage capacities.
Data Centralization – All information, including the cycle diagram, is available in Power BI.
Independence from Legacy Software – Full transition to Power BI without relying on legacy systems.
Interactive Visualization – Enhanced report usability, improved clarity, and the ability to explore data in detail.
We created a modern solution that helps the client manage construction projects more efficiently—all in one place.
Get in Touch with Us
Fill in this form, or, if you prefer, send us an email. Don’t worry, we’ll send you an NDA and your idea will be safe.


